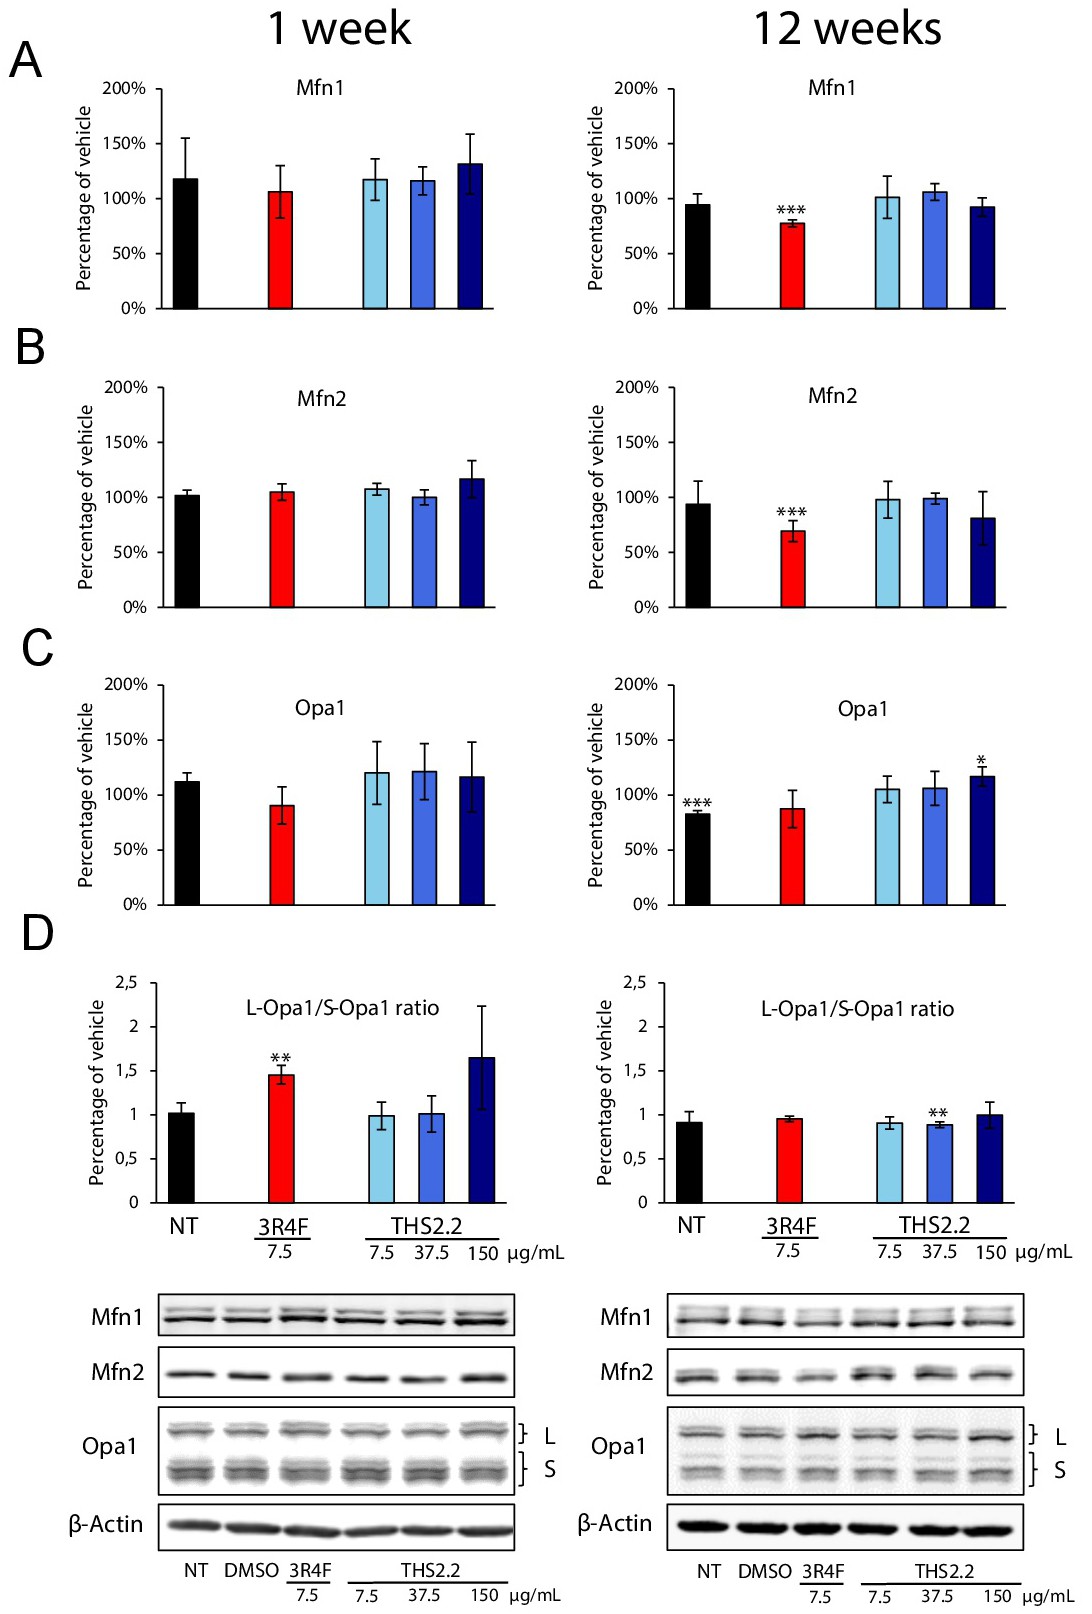
Fig. 6. Effects of one- and 12-week exposures of BEAS-2B cells to TPM from 3R4F reference cigarette smoke (7.5 µg/mL) and THS 2.2 aerosol (7.5 µg/mL, 37.5 µg/mL, and 150 µg/mL) on levels of key fusion proteins. (A) Mfn1, (B) Mfn2, (C) OPA1, (D) ratio of L-OPA1 to S-OPA1 isoforms. Values represent the means ± SD from at least three independent experiments, with representative images of the corresponding Western blots; β-actin was used as the loading control. *p<0.05, **p<0.01, ***p<0.001 compared with vehicle (DMSO)-treated cells. NT, non-treated (control) cells. L - long isoforms of Opa1, S - short isoforms of Opa1.